
Taxable sales is a common and key metric reported for economic performance and it seems appropriate to look beyond the confines of Grand Forks for a time to examine the situation in the state as a whole. To start, let’s ask question to which we already know the answer: what are the big contributing counties to taxable sales and purchases in the state. The answer, as I said, is pretty well known already.

The six largest contributors are pretty obvious with Cass and Williams as the two top performers followed by Burleigh county. Of note is that Grand Forks is actually not distinct in the next tier. It actually is in between Ward and Stark counties. I suspect most people would be able to identify at least five of these counties without thinking very long just based on population size of those counties. A more difficult question, and certainly one that would require more thought, is to address the percentage change from Q1 2018 to Q1 2019 and see which counties are the better performers. The one caveat here is that this is a one-shot look. Surely a record of sustained improvement would be preferred and is something we can look at in future posts.
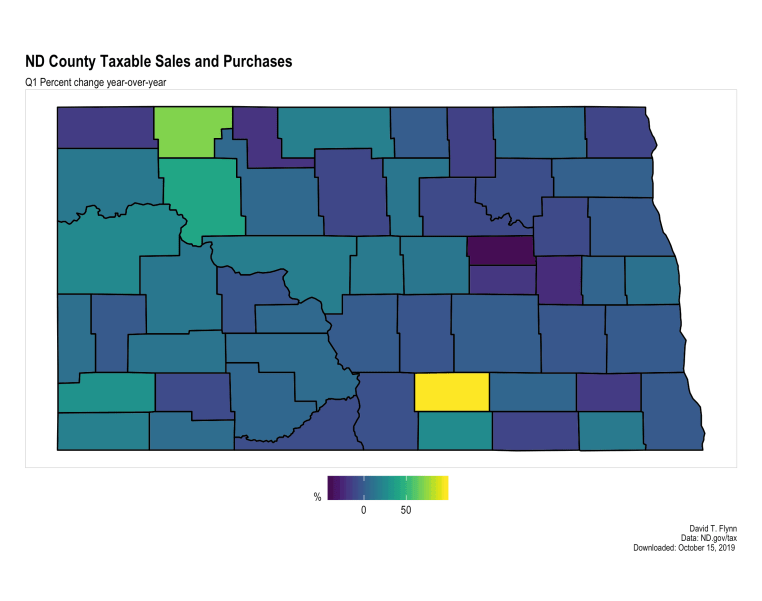
The percentage change is a very different picture. In fact it would appear that there is significantly more clustering of counties, that is there is less distinction between the set of counties. At some level this could be due to the one major outlier in the set of counties, Logan county at 70% percent change year-over-year. Burke county came in at 70% percent change as well. The average for counties overall was 5% for this time period.
How did our large share counties perform in this metric? Burleigh county was down 0.54%, Cass declined 1.31%, Grand Forks was down 1.93%, Stark was up 12.84%, Ward was up 6.18%, and Williams was up 14.93%. What is of note here is something of an East-West divide. The smaller population areas also enjoyed higher growth as another way to divide the group.
What we are seeing is actually a developing and maturing within the state economy. The distinct economic activities within the state are beginning to set the different parts of the state on somewhat distinctive courses. There are, of course, supply chain and labor supply constraint issues within the state. No region is immune from some of those effects. What we also tend to see is different parts of the state will respond and adjust to meet the supply chain needs of other regions and industries. That takes time and is imperfect. A further issue with this is that it does not actually remove the constraint, just changes who bears the burden of the constraint.
This ends up putting the growth and development prospects of the different parts of the state into competition with each other, which is not a bad thing per se. However, it is not something that all areas are ready to undertake, that is, the changed method of negotiation and pursuit of goals. So long as there is clarity in potential returns and allocations of resources the state as a whole should see the best possible returns, but that tends to be little comfort to the substate areas that do not get funding for projects or find it harder to staff positions in key industries due to labor competition elsewhere.
As a last note my growth comment assumes all parties recognize the game they are playing. This is never clear, at least to me. Understanding the nature of the competitive environment, the impacts on potential payoffs and returns, and the implications for strategic decisions is not an easy undertaking. It is here where it becomes important to listen to many voices such as business and labor leaders, as well as local policy authorities, to get a more complete understanding of the economic environment.
