
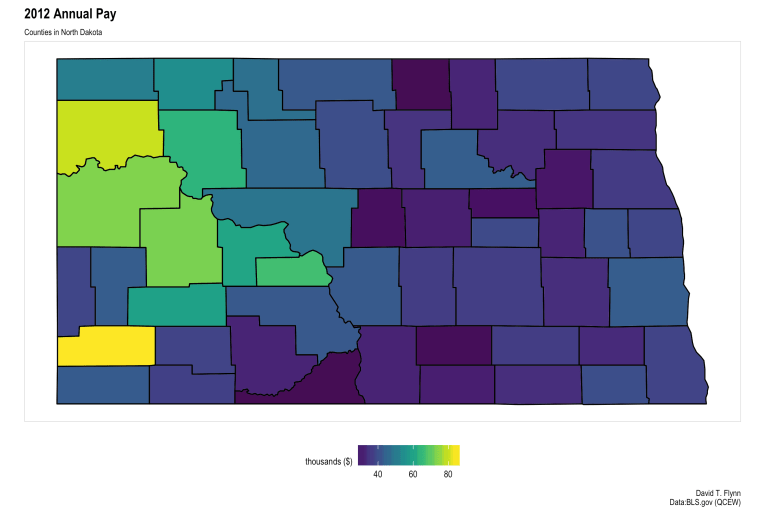
The topic of annual pay clearly was important to many callers last week and so I thought I would follow up with a bit of a different look at the issue. I wanted to take a look state wide at the hot spots for compensation. This is BLS QCEW data for all industries for all firm sizes. I ran it for the last ten years but we are going to look at three years, 2007, 2012, 2017.
There is actually a surprising lack of spatial volatility in the data though the scale for pay rises significantly for 2012 and 2017. What does this tell us? I think it is interesting that county average pay is significantly higher in and around the Bakken area. Those are the hotspots clearly.

Additionally some of the economically bigger areas in the east are not on the upper end. Now one of the big issues I bring up and am still working to address is how to look at the complete distribution. There are separate data sets to utilize for that, but still do not give a complete look at the data distribution which is needed for this.
Interestingly even until 2017 the west remains the hot spot in terms of annual pay. Despite the volatility in oil activity the west remains a source of higher pay. This raises an interesting research question about the momentum from pay increases due to positive economic shocks. How long does that momentum last and at what level?

Relating this back to recent radio conversations this raises an interesting point for discussion about the direction for Grand Forks. Grand Forks is not in the lead tier in terms of compensation in any of these periods and the concern about losses of stores and possible population changes and transitions create more questions than answers in terms of data points to discuss the direction for the community going forward.
